Kimberly Saylor

Data Driven Professional
Natural problem solver who helps others to analyze and understand their data.
View My LinkedIn Profile
Massachusetts Education Analysis
ARE STUDENTS READY FOR GRADUATION?
Being an educator for several years, our school district’s main goal was to prepare our students for the real world. We wanted to gear all of the learning for a student toward their graduation and make sure they are ready to graduate and ready for the future. Teachers focused on what skills a graduate needed to have to be successful in their future job. As young as Kindergarten age, these students were being prepared to find a job and be successful in the workforce. Starting in 4th grade, students began to take standardized tests to predict how successful they would be when they graduated.
Massachusetts schools were also preparing their students for the workforce. The Superintendent wanted to analyze their education data looking for the following information:
- What schools are struggling the most?
- How does class size affect college admission?
- What are the top math schools in the state?
- Create a report to show the school board the state of the school system.
THE DATA
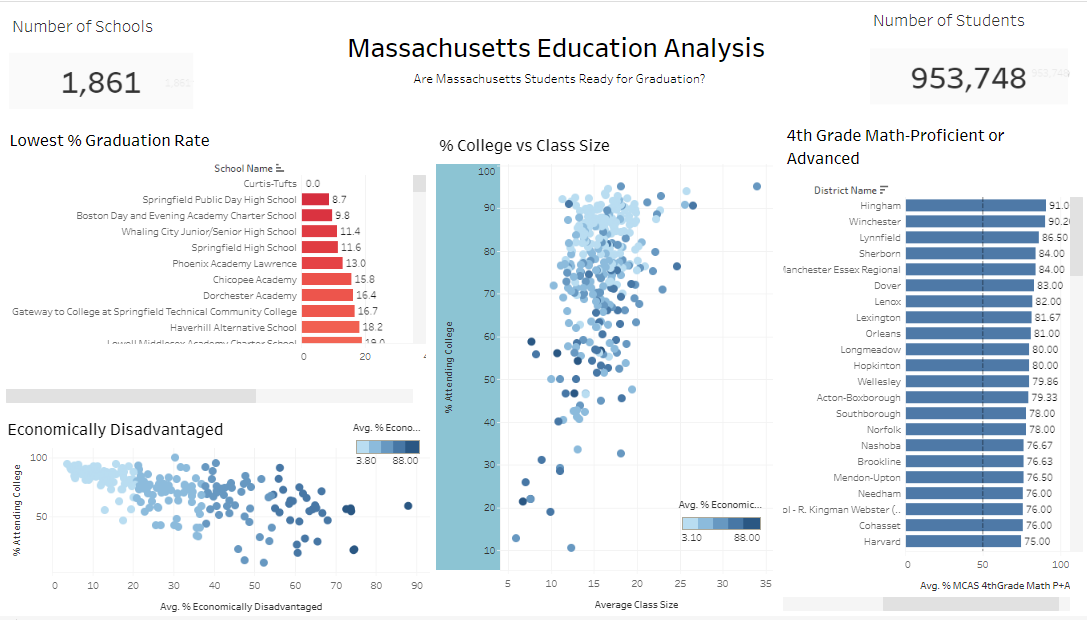
The dataset was provided as a Microsoft Excel file for the year 2017. This data contains 1861 rows of school district data with 299 columns representing information about the schools demographics, class sizes, salaries, expenditures, number of students that graduated, test scores, and other district information.
The data was imported into Tableau to analyze and create the visualization board.
KEY FINDINGS
- Class sizes did not have much impact on graduation rates. Although, the optimum class size falls between 12 and 20 students.
- More Economically disadvantaged schools did have a little lower graduation rate than other schools.
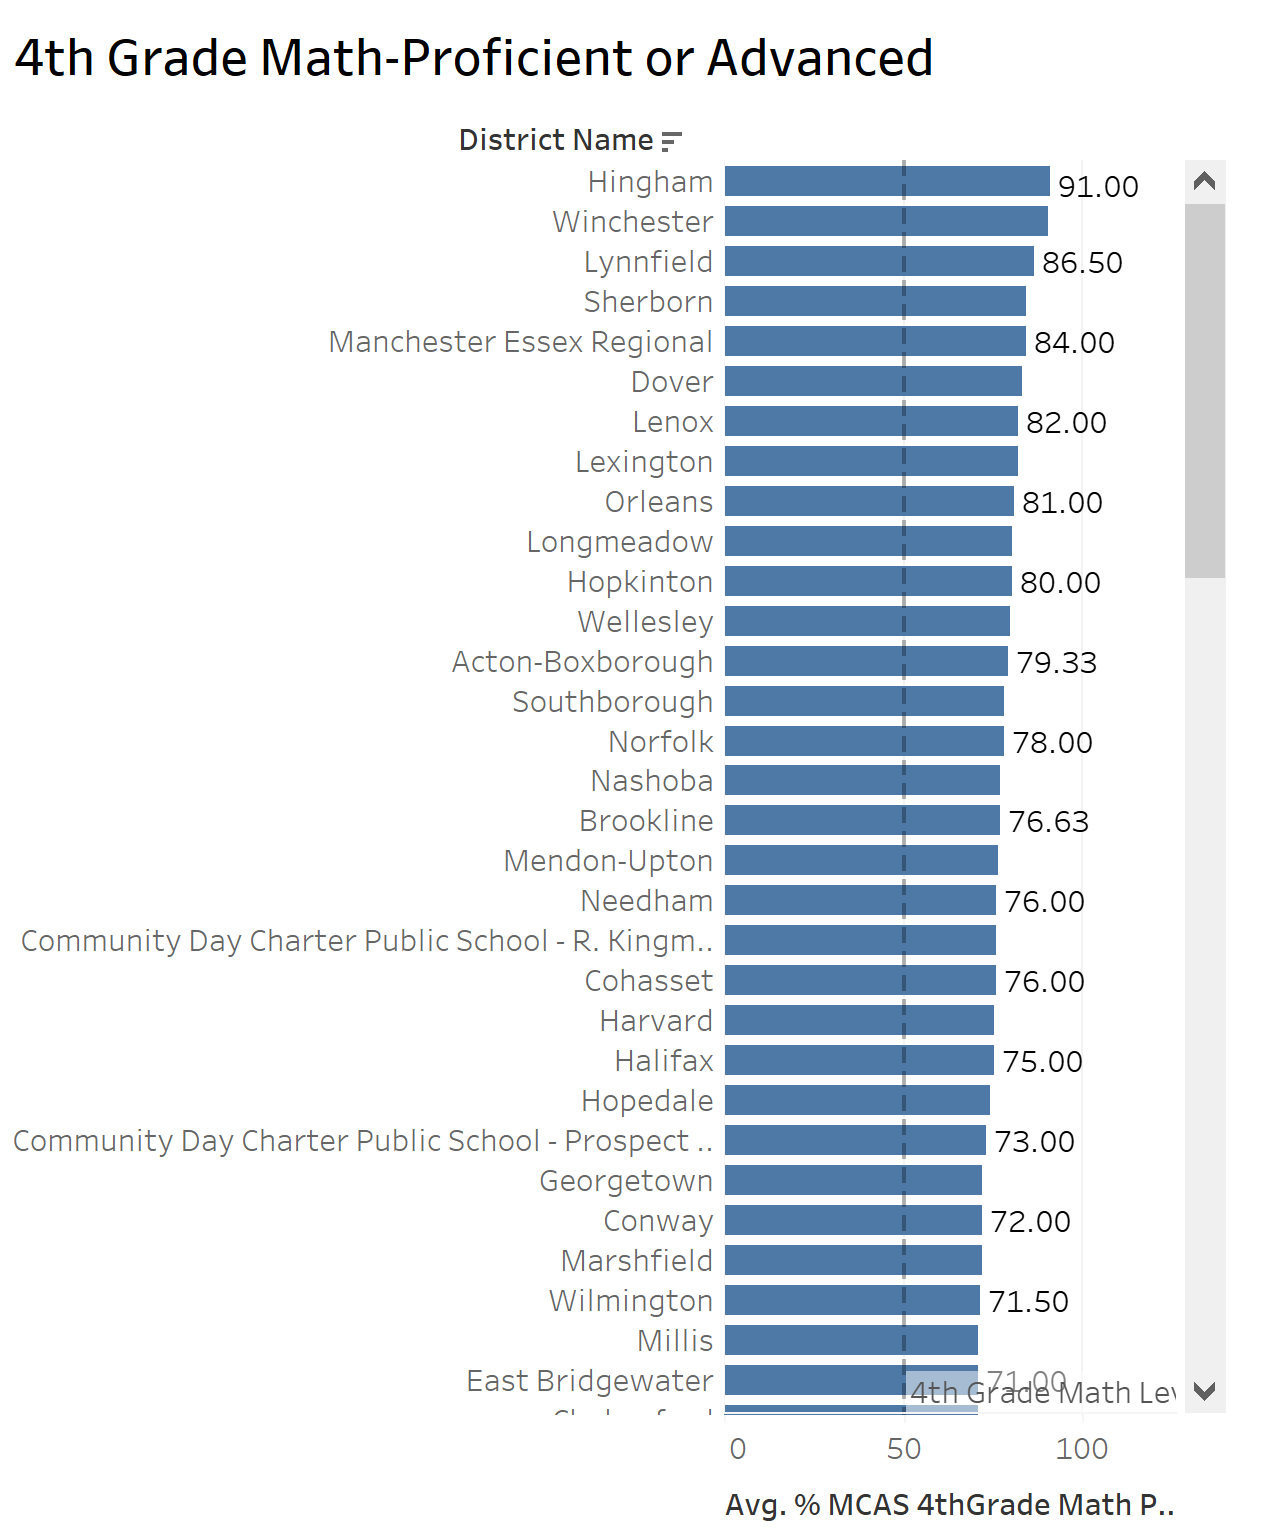
- Finally, 75 schools in Massachusetts scored more than 50% Proficient and Advanced on their 4th grade math assessment.
THE ANALYSIS
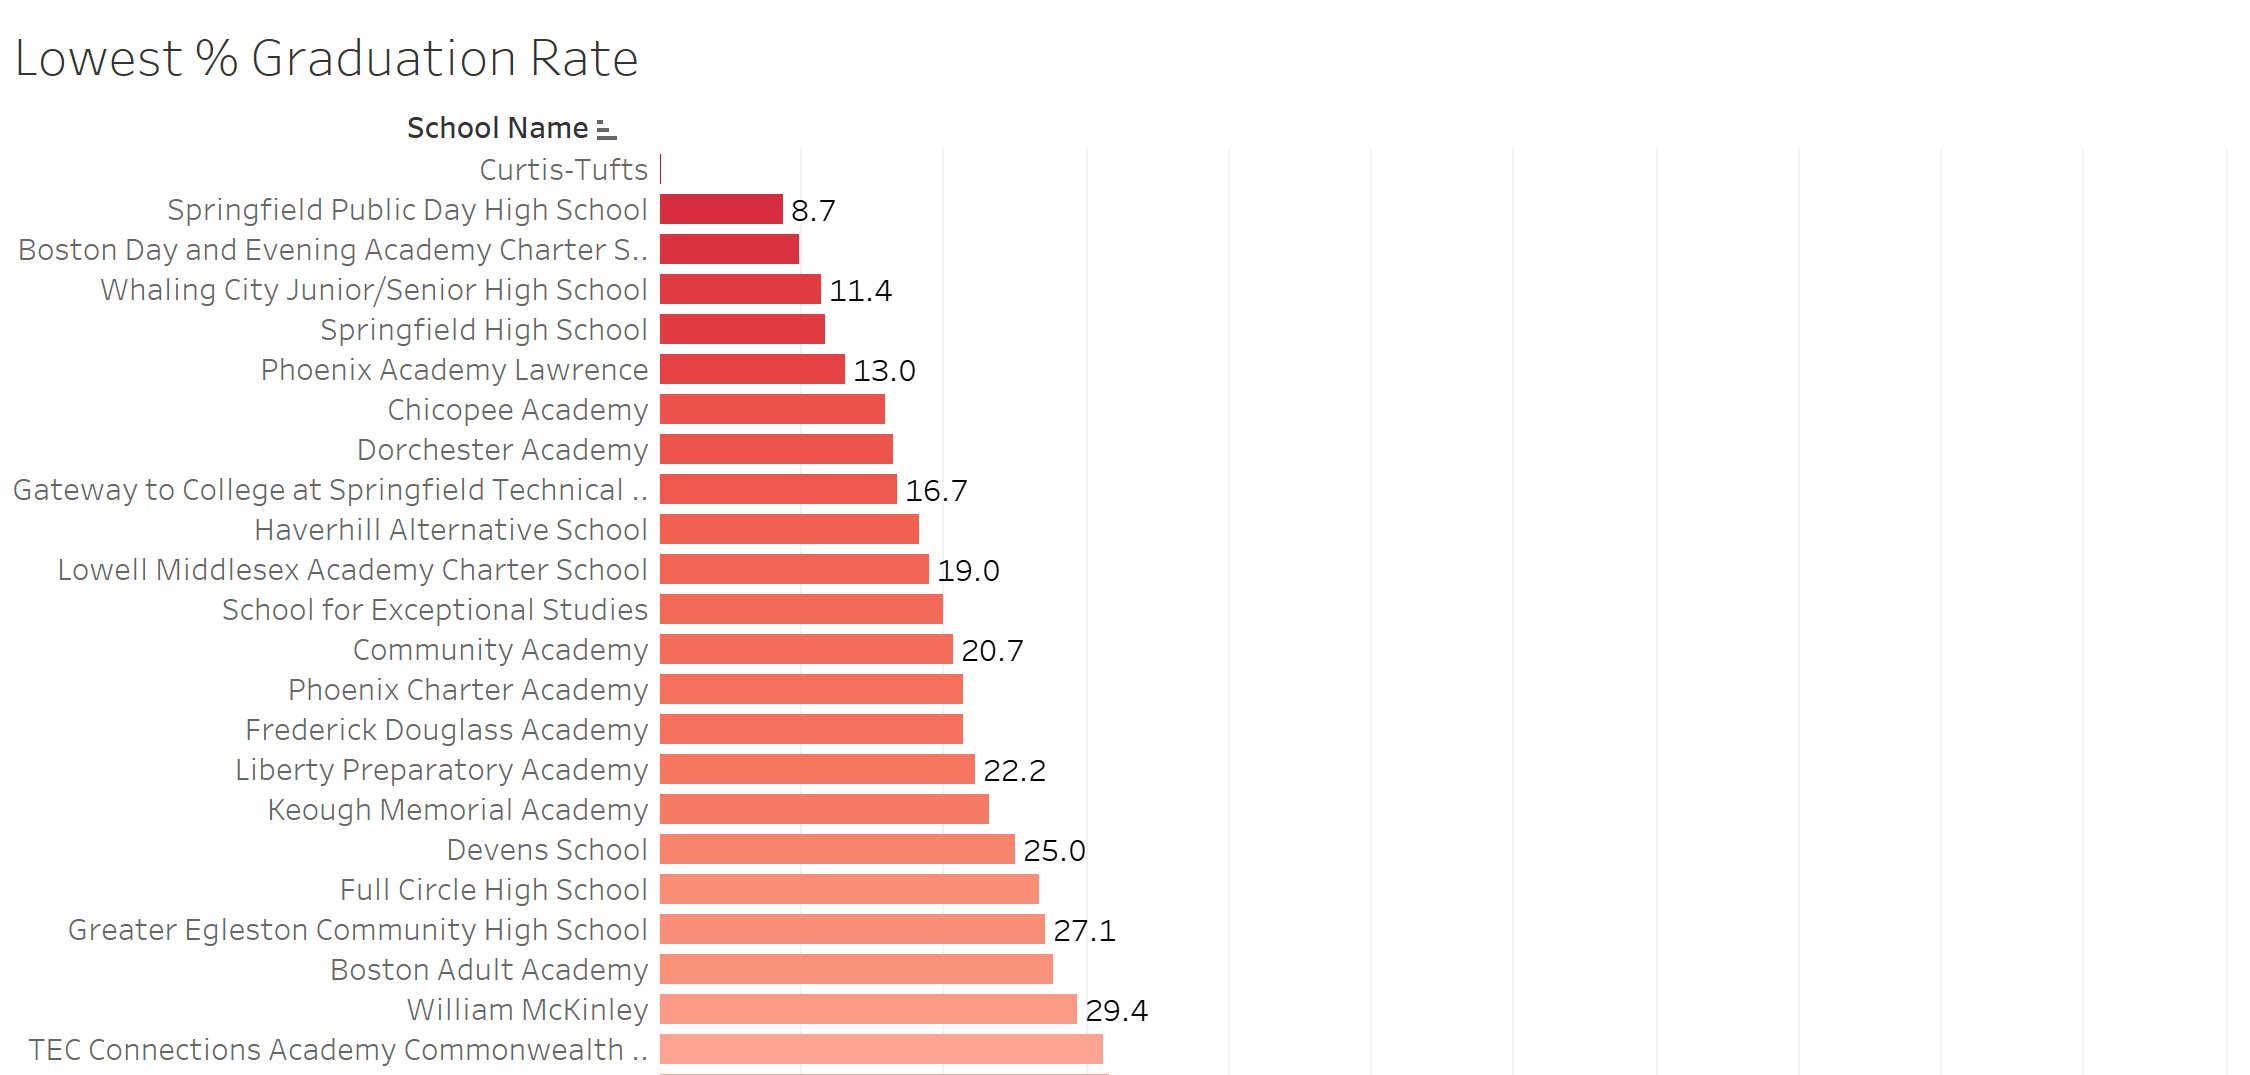
The first task was to find out which schools were struggling the most. In Tableau I created this graph showing the schools with the lowest graduation rate.
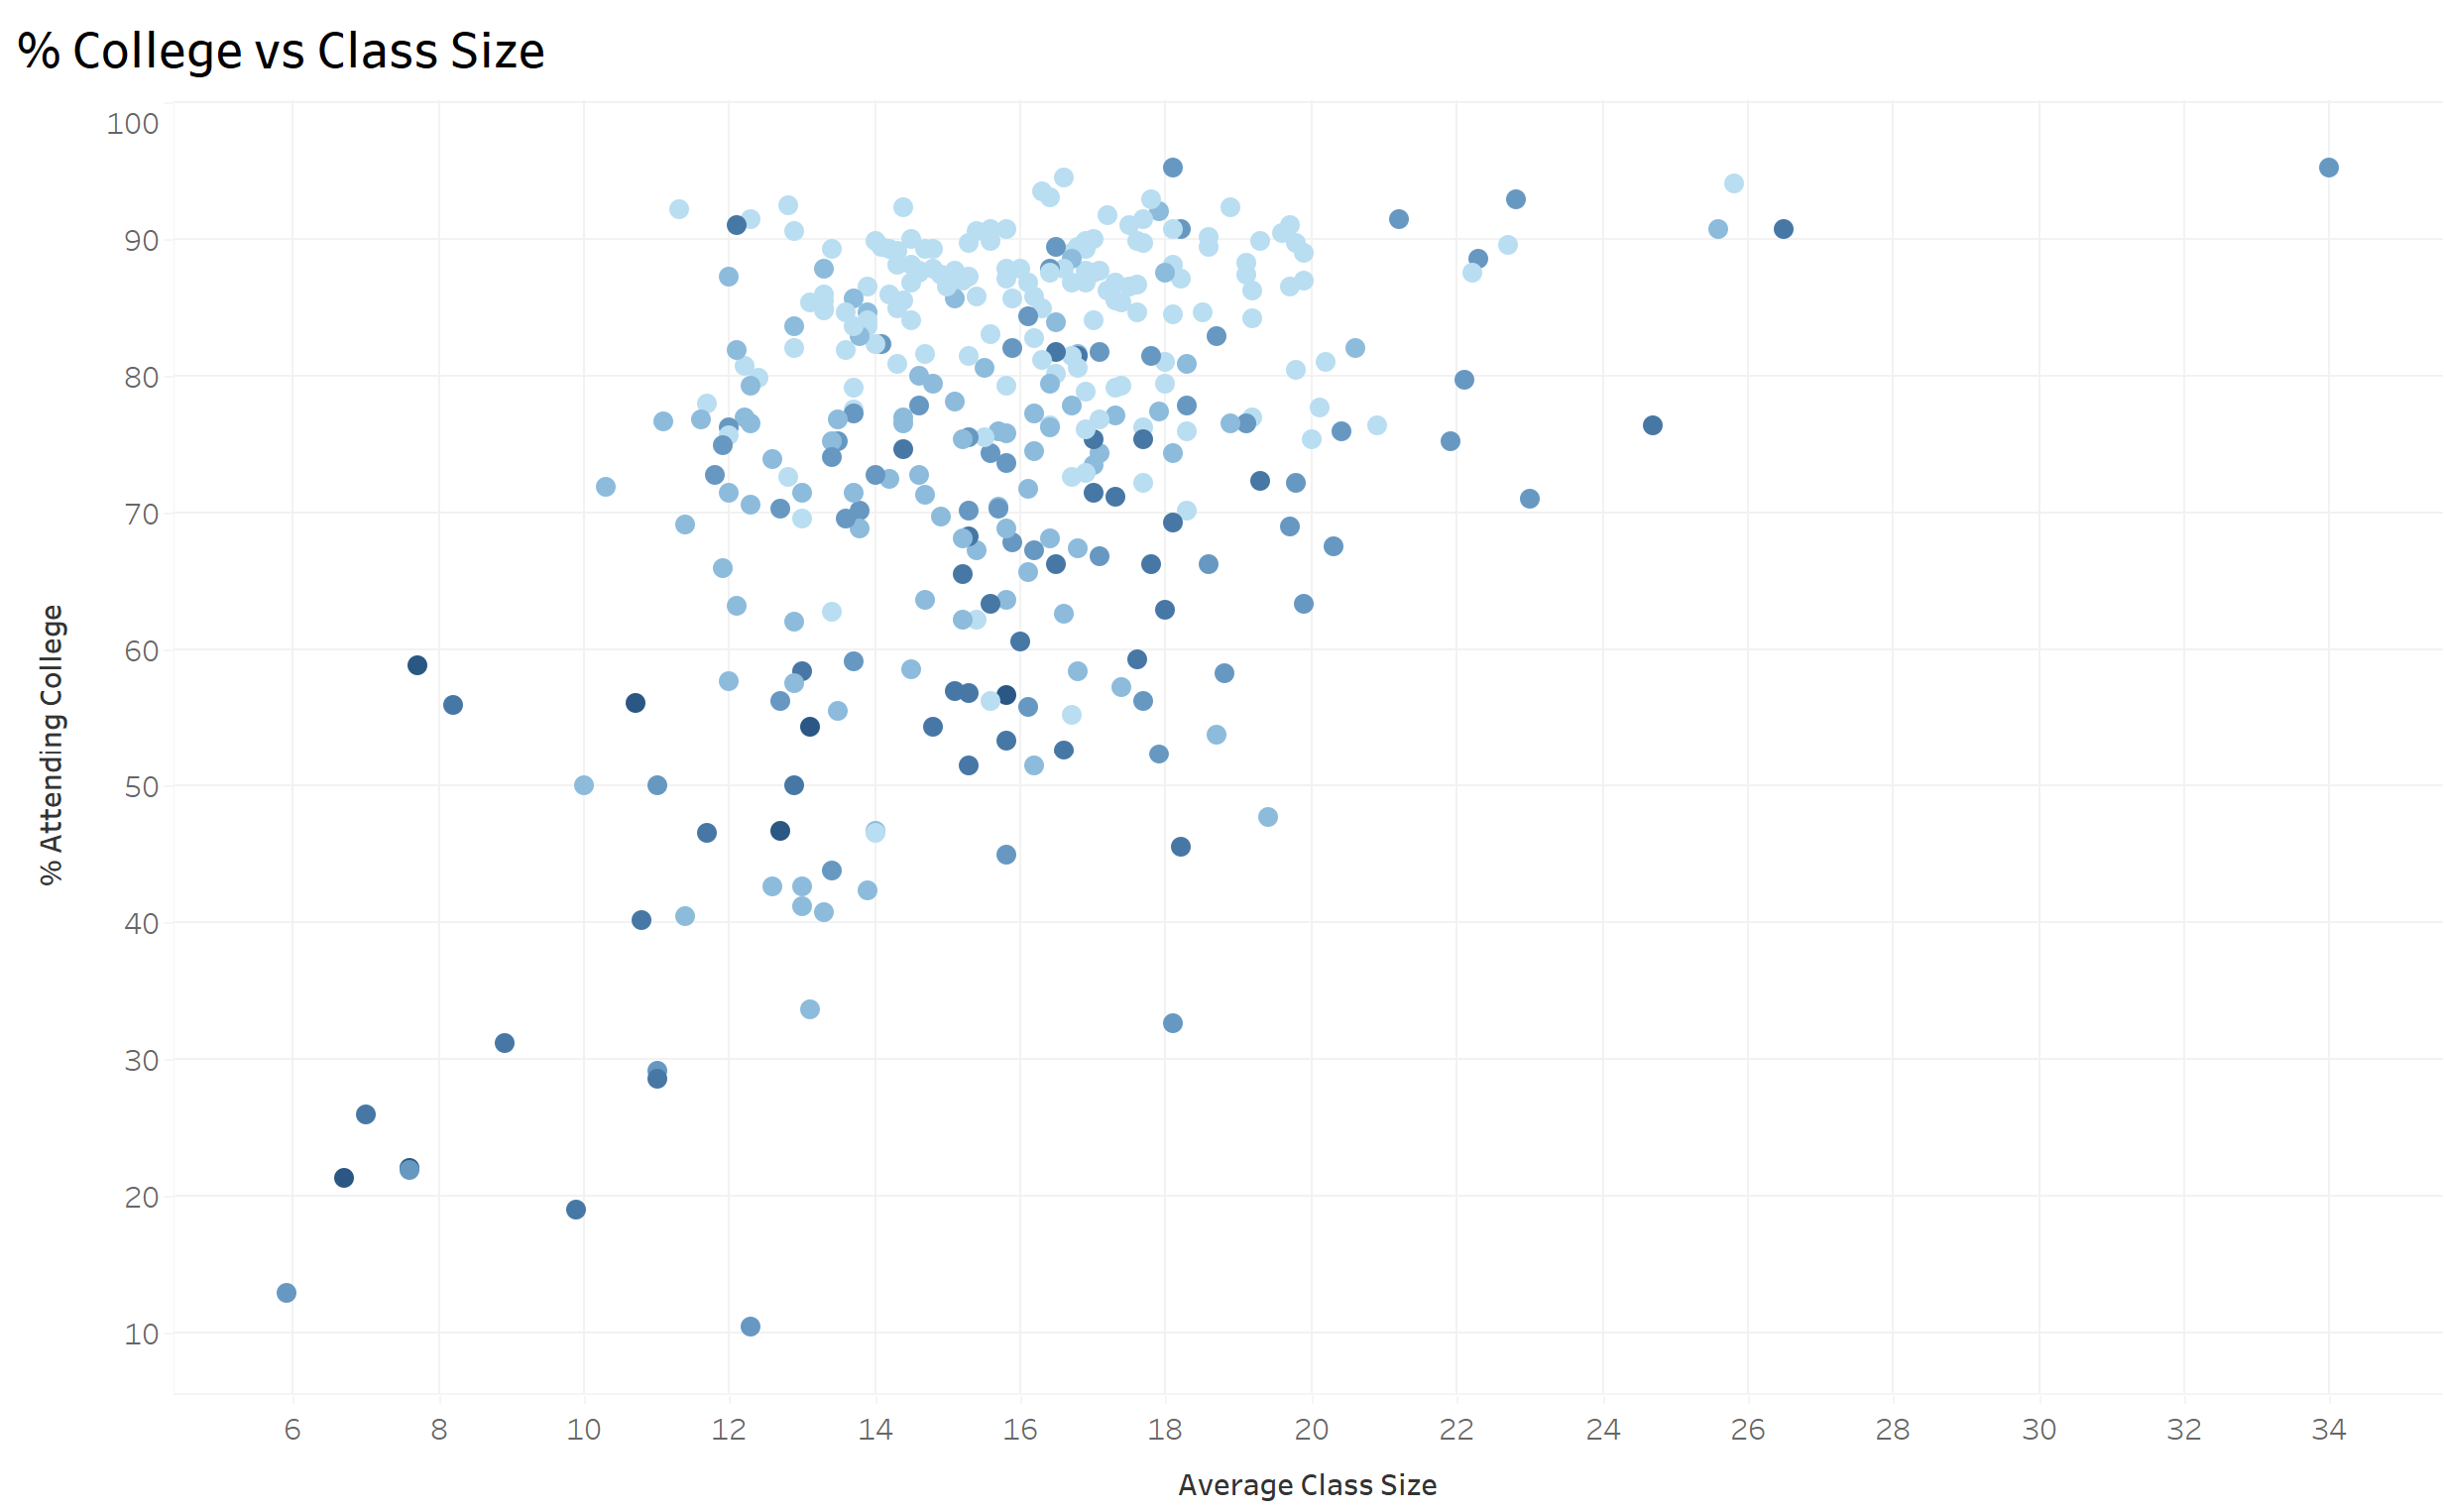
Does Class Size Affect College Admission?
The next task was to find out if class size affects college admission. They are considering investing in building more schools in the aim of lowering the average class size if that would increase the percentage of students attending college. I made a scatter plot with class size to see if there was any correlation between graduation and class size. There was not a strong correlation between these two factors. Therefore, I would not recommend building new schools solely on reducing class sizes.
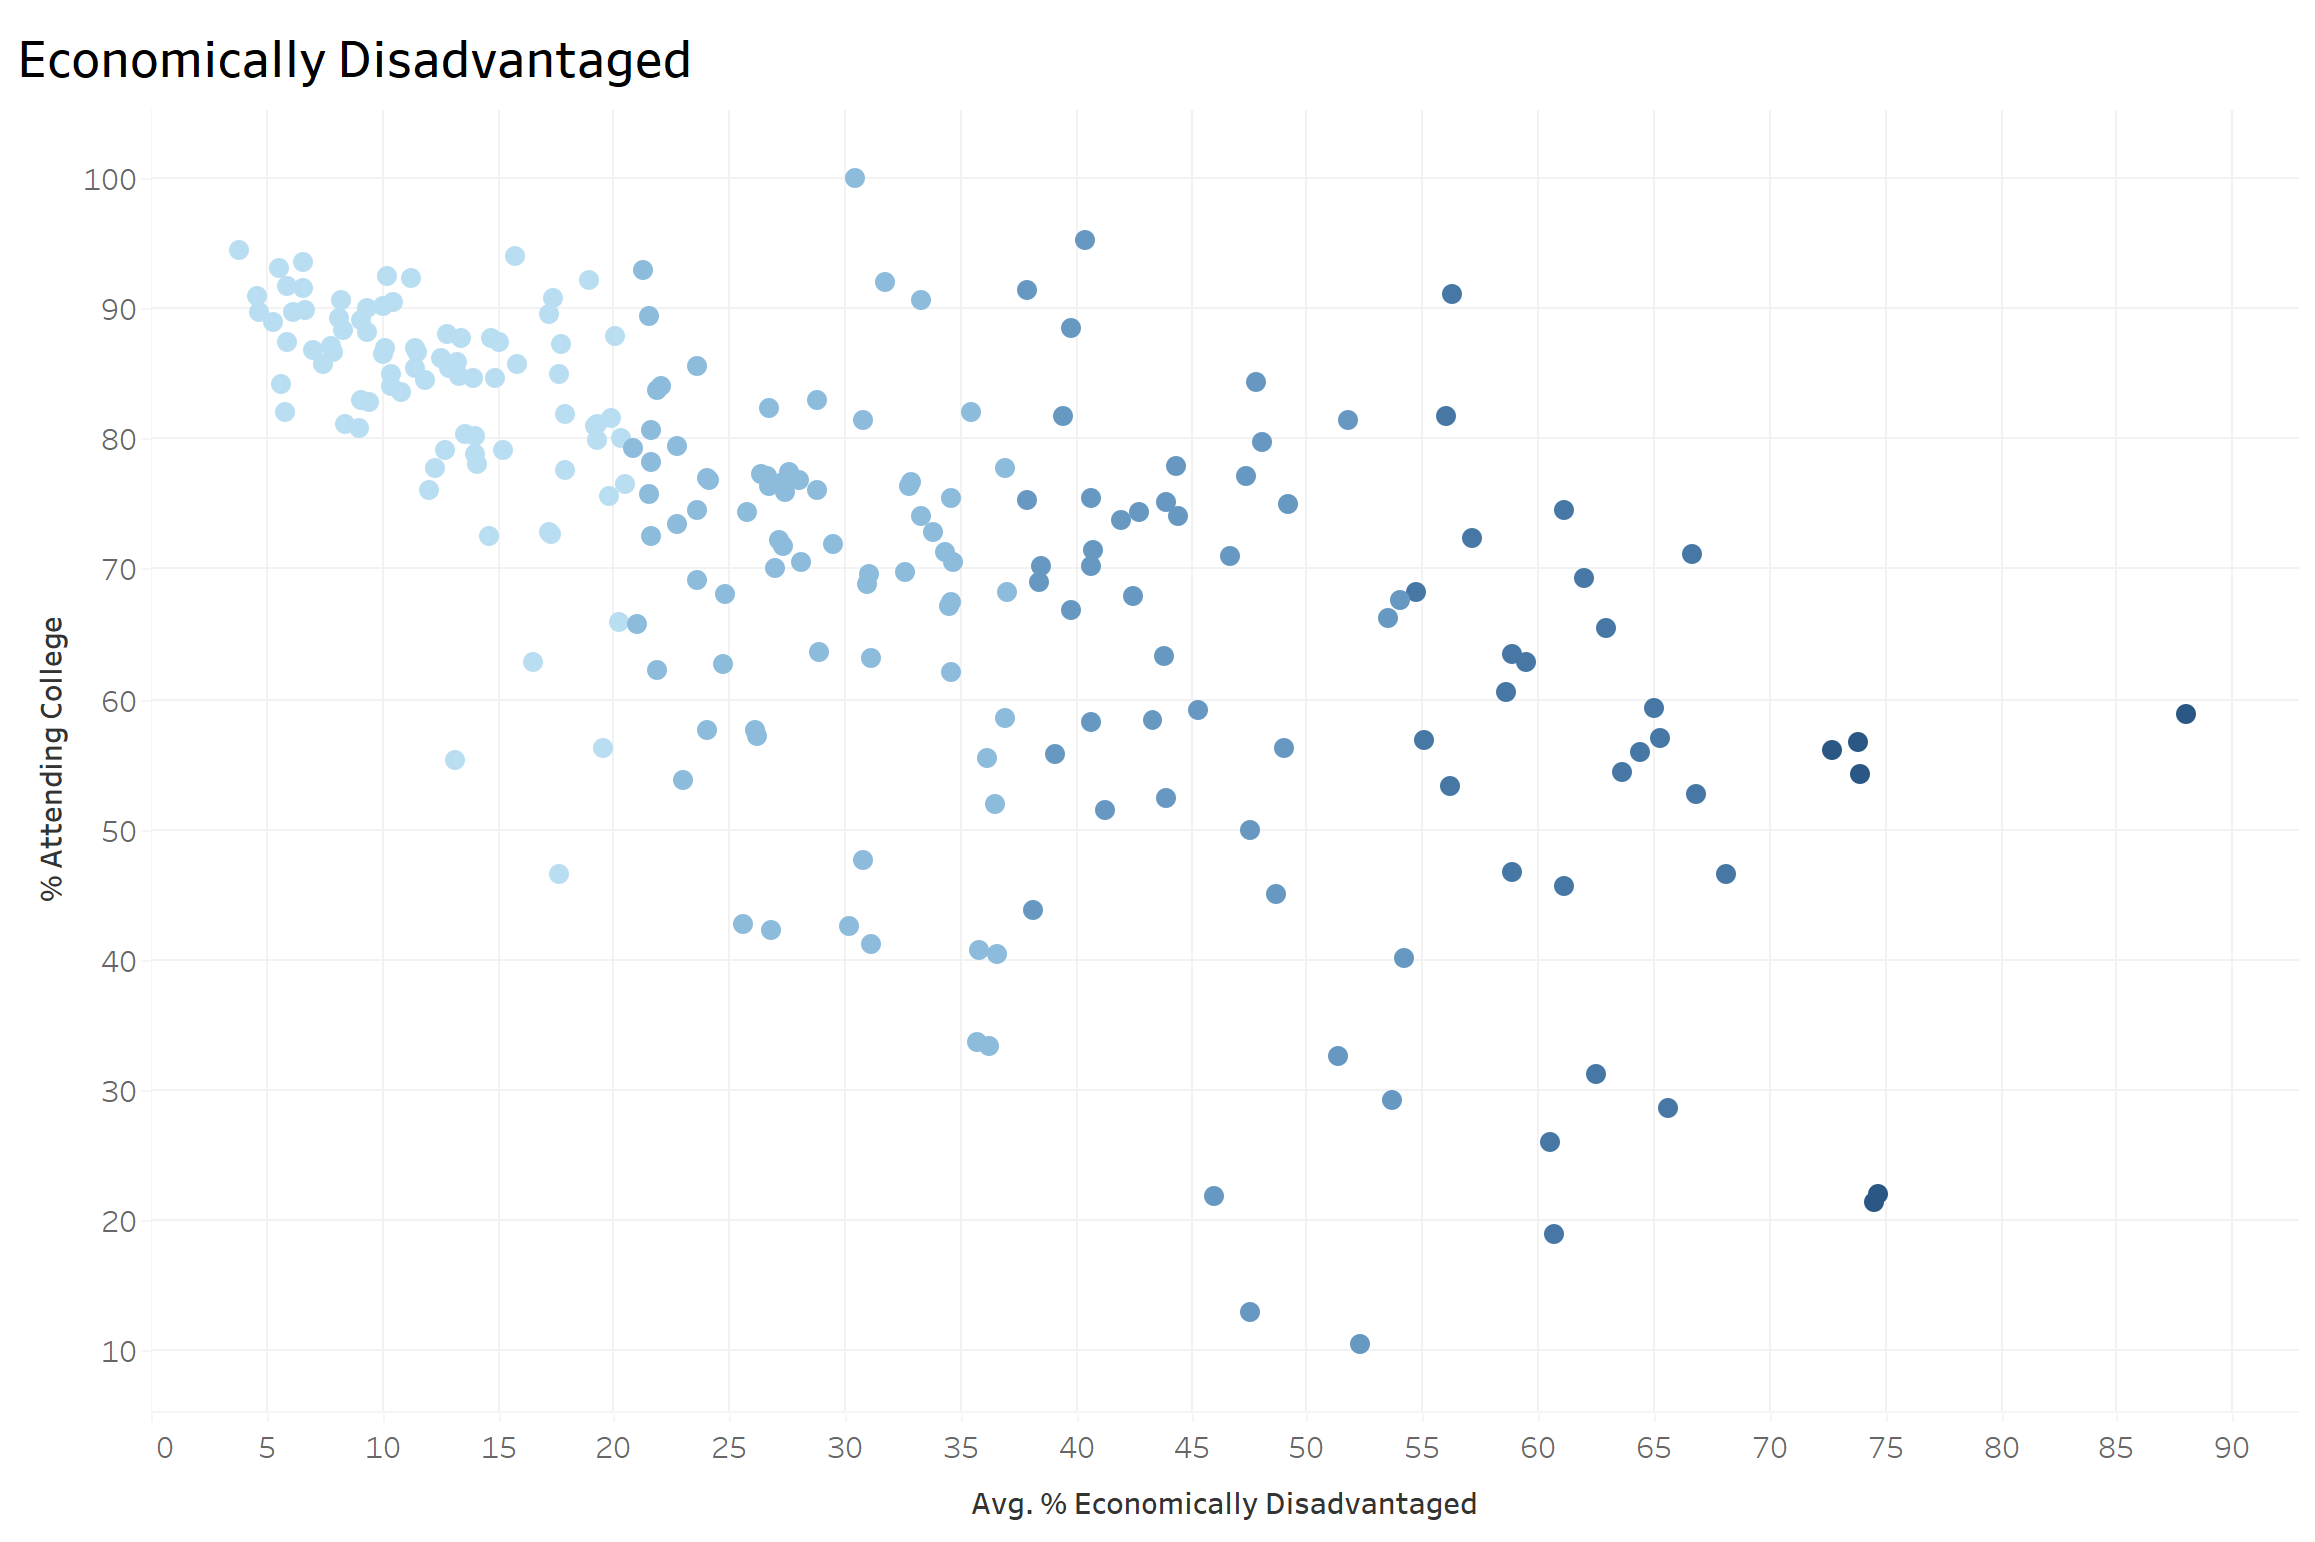
I then factored in the economically disadvantaged students to see if it had an effect on college attendance. It does seem like there’s a slight correlation that the more disadvantaged students there are, the lower the percentage that attended college. The darker the dots on the scatter plots, the higher percentage of economically students attended that school.
What Are The Top Math Schools In The State?
My next task was to determine the top math schools in the state. The superintendent believes that 4th grade math is key to a student’s future and would like to focus on improving the state’s MCAS 4th Grade Math passing value. When analyzing math scores, there were 75 schools where more than 50% of the students were proficient or advanced.
RECOMMENDATIONS
Based on my analysis, here are my recommendations:
- I would not build any new schools just to lower class sizes alone. Class size does not seem to make much of a difference as long as the size stays between 12 and 20. If the outlook of enrollment in a district is going to cause growing numbers in the classroom, that would be the time to look at new buildings.
- I would look further into the economically disadvantaged school districts and research how you can help their disadvantaged students to become more successful and go on to attend college.
- The superintendent wanted to know the schools with the top math scores. There were many schools that reached their requirements, but I would reach out to the top 5 or 6 districts to determine what their teachers are doing to reach the majority of the students in math. Those districts and teachers could provide some Professional Development on best practices for other districts in the state.
Thank you for reading my data analysis about Massachusetts schools. Here is the Dashboard I created in Tableau to complete my analysis.
Click HERE if you would like to see more of the Tableau dashboard and interact with the data.
Follow me on LinkedIn: http://www.linkedin.com/in/kimberlysaylor